Scripting (or any kind of programming) is relatively easy once you get used to it. However, even the best programmers make mistakes, and need to iron the occasional wrinkle out of their code. Being good at debugging scripts will reduce the time to market for your projects and increase the amount of sleep you get at night. Please read this section for tips on using Auto Play Media Studio as smartly and effectively as possible!
This section will explain AutoPlay Media StudioÆs error handling methods as well as cover a number of debugging techniques.
All of the built-in AutoPlay Media Studio actions use the same basic error handling techniques. However, this is not necessarily true of any third-party functions, modules, or scriptsŚeven scripts developed by Indigo Rose Corporation that are not built into the product. Although these externally developed scripts can certainly make use of AutoPlay's error handling system, they may not necessarily do so. Therefore, you should always consult a script or module's author or documentation in order to find out how error handling is, well, handled.
There are two kinds of errors that you can have in your scripts when calling AutoPlay Media Studio actions: syntax errors, and functional errors.
Syntax errors occur when the syntax (or ōgrammarö) of a script is incorrect, or a function receives arguments that are not appropriate. Some syntax errors are caught by AutoPlay Media Studio when you build or preview your application.
For example, consider the following script:
foo =
This is incorrect because we have not assigned anything to the variable fooŚthe script is incomplete. This is a pretty obvious syntax error, and would be caught by the scripting engine at build time (when you build your project).
Another type of syntax error is when you do not pass the correct type or number of arguments to a function. For example, if you try and run this script:
Dialog.Message("Hi There");
...the project will build fine, because there are no obvious syntax errors in the script. As far as the scripting engine can tell, the function call is well formed. The name is valid, the open and closed parentheses match, the quotes are in the right places, and thereÆs even a terminating semi-colon at the end. Looks good!
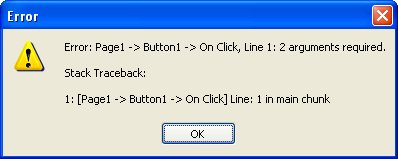
However, at run time you would see something like the following:

Looks like it wasnÆt so good after all. Note that the message says two arguments are required for the Dialog.Message function. Ah. Our script only provided one argument.
According to the function prototype for Dialog.Message, it looks like the function can actually accept up to five arguments:

Looking closely at the function prototype, we see that the last three arguments have default values which will be used if those arguments are omitted from the function call. The first two argumentsŚTitle and TextŚdonÆt have default values, so they cannot be omitted without generating an error. To make a long story short, itÆs okay to call the Dialog.Message action with anywhere from 2 to 5 arguments...but 1 argument isnÆt enough.
Fortunately, syntax errors like these are usually caught at build time or when you test your application. The error messages are usually quite clear, making it easy for you to locate and identify the problem.
Functional errors are those that occur because the functionality of the action itself fails. They occur when an action is given incorrect information, such as the path to a file that doesnÆt exist. For example, the following code will produce a functional error:
filecontents = TextFile.ReadToString("this_file_don't exist.txt");
If you put that script into an event right now and try it, you will see that nothing appears to happen. This is because AutoPlay Media StudioÆs functional errors are not automatically displayed the way syntax errors are. We leave it up to you to handle (or to not handle) such functional errors yourself.
The reason for this is that there may be times when you donÆt care if a function fails. In fact, you may expect it to. For example, the following code tries to remove a folder called C:\My Temp Folder:
Folder.Delete("C:\\My Temp Folder");
However, in this case you donÆt care if it really gets deleted, or if the folder didnÆt exist in the first place. You just want to make sure that if that particular folder exists, it will be removed. If the folder isnÆt there, the Folder.Delete action causes a functional error, because it canÆt find the folder you told it to delete...but since the end result is exactly what you wanted, you donÆt need to do anything about it. And you certainly donÆt want the user to see any error messages.
Conversely, there may be times when it is very important for you to know if an action fails. Say for instance that you want to copy a very important file:
File.Copy("C:\\Temp\\My File.dat","C:\\Temp\\My File.bak");
In this case, you really want to know if it fails and may even want to exit the program or inform the user. This is where the Debug actions come in handy. Read on.
AutoPlay Media Studio comes with some very useful functions for debugging your applications. This section will look at a number of them.
This is the most important action to use when trying to find out if a problem has occurred. At run time there is always an internal value that stores the status of the last action that was executed. At the start of an action, this value is set to 0 (the number zero). This means that everything is OK. If a functional error occurs inside the action, the value is changed to some non-zero value instead.
This last error value can be accessed at any time by using the Application.GetLastError action.
The syntax is:
last_error_code = Application.GetLastError();
Here is an example that uses this action:
File.Copy("C:\\Temp\\My File.dat","C:\\Temp\\My
File.bak");
error_code = Application.GetLastError();
if (error_code ~= 0) then
-- some kind of error has occurred!
Dialog.Message("Error", "File copy
error: "..error_code);
Application.Exit();
end
The above script will inform the user that an error occurred and then exit the application. This is not necessarily how all errors should be handled, but it illustrates the point. You can do anything you want when an error occurs, like calling a different function or anything else you can dream up.
The above script has one possible problem. Imagine the user seeing a message like this:
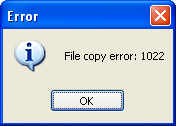
It would be much nicer to actually tell them some information about the exact problem. Well, you are in luck! At run time there is a table called _tblErrorMessages that contains all of the possible error messages, indexed by the error codes. You can easily use the last error number to get an actual error message that will make more sense to the user than a number like ō1182.ö
For example, here is a modified script to show the actual error string:
File.Copy("C:\\Temp\\My File.dat","C:\\Temp\\My
File.bak");
error_code = Application.GetLastError();
if (error_code ~= 0) then
-- some kind of error has occurred!
Dialog.Message("Error", "File copy
error: " ..
_tblErrorMessages[error_code]);
Application.Exit();
end
Now the script will produce the following error message:

Much better information!
Just remember that the value of the last error gets reset every time an action is executed. For example, the following script would not produce an error message:
File.Copy("C:\\Temp\\My File.dat","C:\\Temp\\My
File.bak");
-- At this point Application.GetLastError() could be non-zero, but...
Dialog.Message("Hi There","Hello World");
-- Oops, now the last error number will be for the Dialog.Message action,
-- and not the File.Copy action. The Dialog.Message action will reset the
-- last error number to 0, and the following lines will not catch any
-- error that happened in the File.Copy action.
error_code = Application.GetLastError();
if (error_code ~= 0) then
-- some kind of error has occurred!
Dialog.Message("Error",
"File copy error: "..
_tblErrorMessages[error_code]);
Application.Exit();
end
The AutoPlay Media Studio runtime has the ability to show a debug window that can be used to display debug messages. This window exists throughout the execution of your application, but is only visible when you tell it to be.
The syntax is:
Debug.ShowWindow(show_window);
...where show_window is a Boolean value. If true, the debug window is displayed, if false, the window is hidden. For example:
-- show the debug window
Debug.ShowWindow(true);
If you call this script, the debug window will appear on top of your application, but nothing else will really happen. ThatÆs where the following Debug actions come in.
This action prints the text of your choosing in the debug window. For example, try the following script:
Debug.ShowWindow(true);
for i = 1, 10 do
Debug.Print("i = " .. i .. "\r\n");
end
The ō\r\nö part is actually two escape sequences that are being used to start a new line. (This is technically called a ōcarriage return/linefeedö pair.) You can use \r\n in the debug window whenever you want to insert a new line.
The above script will produce the following output in the debug window:
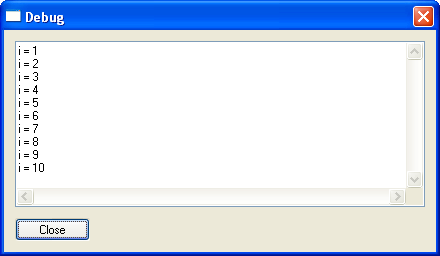
You can use this method to print all kinds of information to the debug window. Some typical uses are to print the contents of a variable so you can see what it contains at run time, or to print your own debug messages like ōinside outer for loopö or ōfoo() function started.ö Such messages form a trail like bread crumbs that you can trace in order to understand whatÆs happening behind the scenes in your project. They can be invaluable when trying to debug your scripts or test your latest algorithm.
AutoPlay Media Studio can run in a special ōtraceö mode at run time that will print information about every line of script that gets executed to the debug window, including the value of Application.GetLastError() if the line involves calling a built-in action. You can turn this trace mode on or off by using the Debug.SetTraceMode action:
Debug.SetTraceMode(turn_on);
...where turn_on is a Boolean value that tells the program whether to turn the trace mode on or off.
Here is an example:
Debug.ShowWindow(true);
Debug.SetTraceMode(true);
for i = 1, 3 do
Dialog.Message("Number", i);
end
File.Copy("C:\\fake_file.ext", "C:\\fake_file.bak");
Running that script will produce the following output in the debug window:
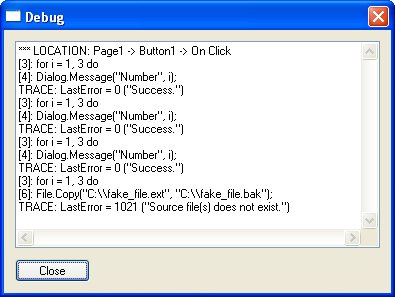
Notice that every line produced by the trace mode starts with ōTRACE:ö This is so you can tell them apart from any lines you send to the debug window with Debug.Print. The number after the ōTRACE:ö part is the line number that is currently being executed in the script.
Turning trace mode on is something that you will not likely want to do in your final, distributable application, but it can really help find problems during development. In fact, there is an option in the AutoPlay Media Studio build preferences that allows you to automatically turn on trace mode every time you preview. (Choose Tools > Preferences and click on the Build category. In the Preview section, turn on the option called ōShow Debug Window.ö) However, even with this option enabled, trace mode will not be turned on in the version that gets built when you publish your project, unless you specifically turn it on in your script.
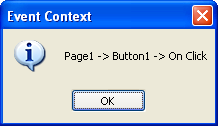
This action is used to get a descriptive string about the event that is currently being executed. This can be useful if you define a function in one place but call it somewhere else, and you want to be able to tell where the function is being called from at any given time. For example, if you execute this script from a buttonÆs On Click event on Page1:
Dialog.Message("Event Context", Debug.GetEventContext());
...you will see something like this:
This brings us to good oleÆ Dialog.Message. You have seen this action used throughout this document, and for good reason. This is a great action to use throughout your code when you are trying to track down a problem.